
THE TECHNOLOGY

See Your Brain In Action

Everyone has a brain. Everyone moves. Neuromotor control, how the brain and body work together in real time, is what lets you drive, type, or catch your balance, all at once. It's invisible until it changes, often showing up as clumsiness or confusion before anyone can explain why. NERON measures that shift directly, in minutes, requiring neither wearables nor specialized training, so it doesn't stay invisible.

Touchscreen  neurotechnology
52+ Peer-reviewed studies
3D Brain Signature™ output
4 Executive-motox domains

IN PRACTICE

Clinicians diagnose. Researchers study. Program leads deliver.

NERON is the measurement layer underneath all three, supporting the programs and services already in place.

IN PRACTICE

Clinicians diagnose. Researchers study. Program leads deliver.

NERON is the measurement layer underneath all three, supporting the programs and services already in place.

THE TECHNOLOGY

A platform that makes the invisible visible.

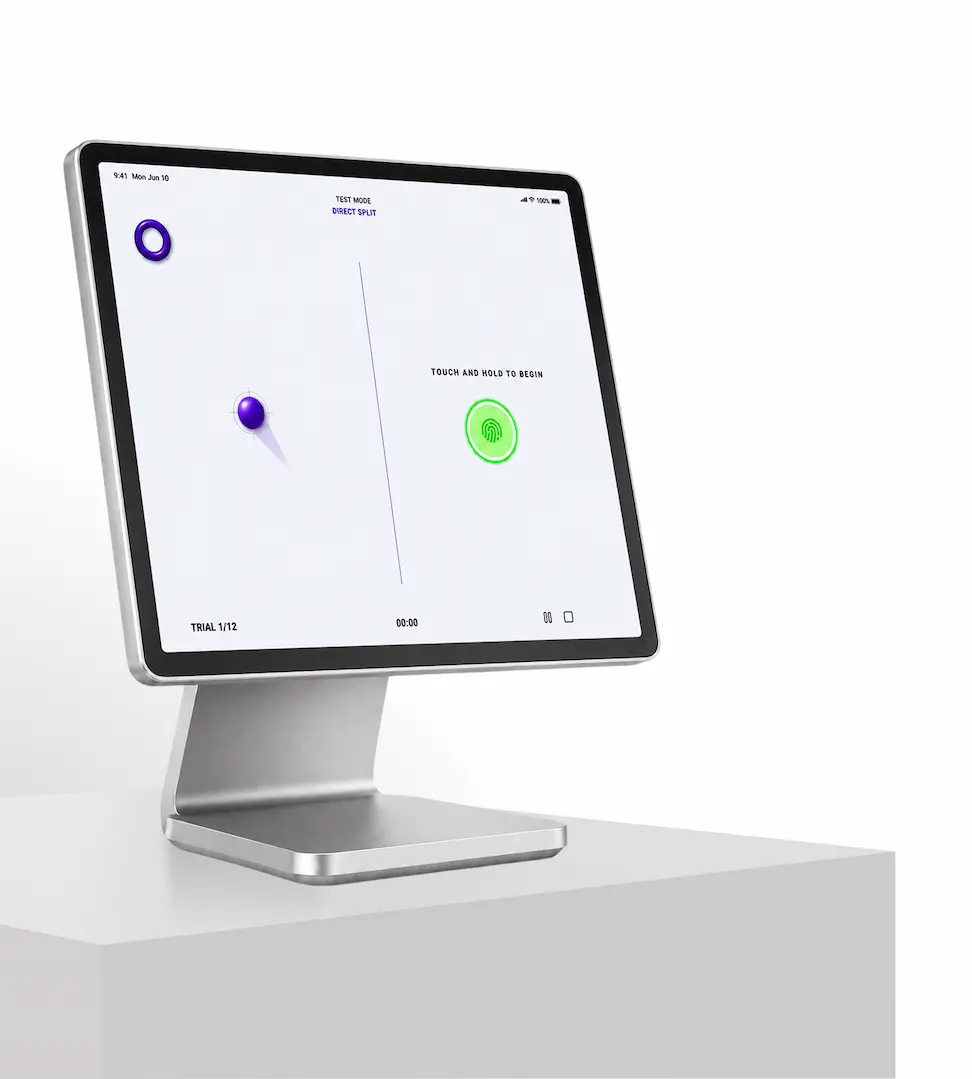
NERON is a touchscreen-based technology platform that objectively measures the brain's ability to plan and execute movement when visual guidance is indirect - like using a mouse, a remote control, or a surgical instrument.

Built on more than twenty years of neuroscience research and validated through 52+ peer-reviewed studies, NERON provides a sensitive, objective measure of neuromotor control, wherever that connection needs to be tracked.

NERON turns subtle movement patterns into a precise, data-driven brain vital sign.

IN PRACTICE

Clinicians diagnose. Researchers study. Program leads deliver.

NERON is the measurement layer underneath all three, supporting the programs and services already in place.

Touchscreen  neurotechnology
52+ Peer-reviewed studies
3D Brain Signature™ output
4 Executive-motox domains
THE CORE MEASURE

Neuromotor Reserve: how much control is left when it's needed most.

Neuromotor Reserve is the buffer between how someone moves at rest and how they move under pressure, when driving, multitasking, or reacting fast. The bigger the buffer, the more room there is before performance breaks down.

Every NERON measurement produces a single Brain Score - a 0-100 Neuromotor Reserve rating - by comparing movement control at baseline against movement control under cognitive load. The size of the drop between the two is the signal.

80
NEUROMOTOR RESERVE
High
0
75 - 85 Normal
100
01
Your Brain Score: a single 0-100 rating of Neuromator Reserve
Strengths
Holds up best under cognitive load
Focus (Attention)
Switching (Motor Flexibility)
GROWTH OPPORTUNITIES
Loses the most control under cognitive load
Working Memory
Stopping (Inhibitory-Motor Control)
02
Where your score holds up, and where it's most likely to change under pressure.
BRAIN AT REST
84
03
Movement control with nothing else competing for attention.
BRAIN UNDER LOAD
76
04
Movement measured while the brain is also thinking.
IMPACT ON THE BRAIN
10%
05
How much control is lost when both happen at once; this is Neuromotor Reserve.
THE CORE MEASURE

Four domains, tested under real cognitive load.

Each domain is measured twice: once at rest, once while the brain is busy with a competing cognitively demanding task.. The difference between the two? Neuromotor Reserve.

i
Attention
The ability to sustain and direct attention on the movement itself while a competing task pulls for the same mental resources
ii
Impulse Control
The ability to flexibly shift a movement plan mid-execution when the cognitive task changes what's being asked of it.
iii
Inhibitory-Motor Control
The ability to suppress an incorrect or automatic movement In favor of the one the cognitive task actually calls for.
iv
Working Memory
The ability to hold information in mind, like a target location or a rule, while still executing the moment
PERFORMANCE-BASED MEASUREMENT

What NERON produces- and how to read it.

BRAIN SIGNATURE™
A detailed view of the brain, IN 3D.
A detailed view of how the brain controls movement, revealing patterns in coordination, adaptability, and brain-body communication that traditional tests don't capture.
How to read it: Distance from the population norm shows where performance sits; the shape reveals the cognitive load on the brain. The wavier, then the harder the brain is working.
DERIVED FROM REAL MOVEMENT DATA - NO EQUIVALENT IN STANDARD TESTING
Brain PERFORMANCE Score™
A single, comparable number.
A single, easy-to-understand score reflecting today's brain performance, benchmarked against past results and your current performance zone. Read it as: a trend, not a verdict - most meaningful in how it moves over time.
PERFORMANCE ZONE
The context band.
A clear range showing where brain performance falls today, and how it moves over time. Read it as: where function sits today and which direction it is trending, so a number always has a reference.
CRITICAL
OPTIMIAL
PROGRESS TRACKING
The longitudinal record.
Visual tracking of brain performance over time, showing trends, improvement, or meaningful change. Read it as: the trajectory of performance, recovery, or change across weeks, months, and years - comparable across sessions and providers.

Better decisions begin with better measurement.

Understand where you are today. • Recognize meaningful change earlier. • Track brain performance with confidence.

Measure your brain performance. Understand what comes next.

Select your primary application